Graphs
Can you plot these graphs?
Can you write the code for these graphs? In all cases you should start with checking out the data frame to identify the names of the columns (variables) to plot on the x and y axes. This can be done with the $ operator.
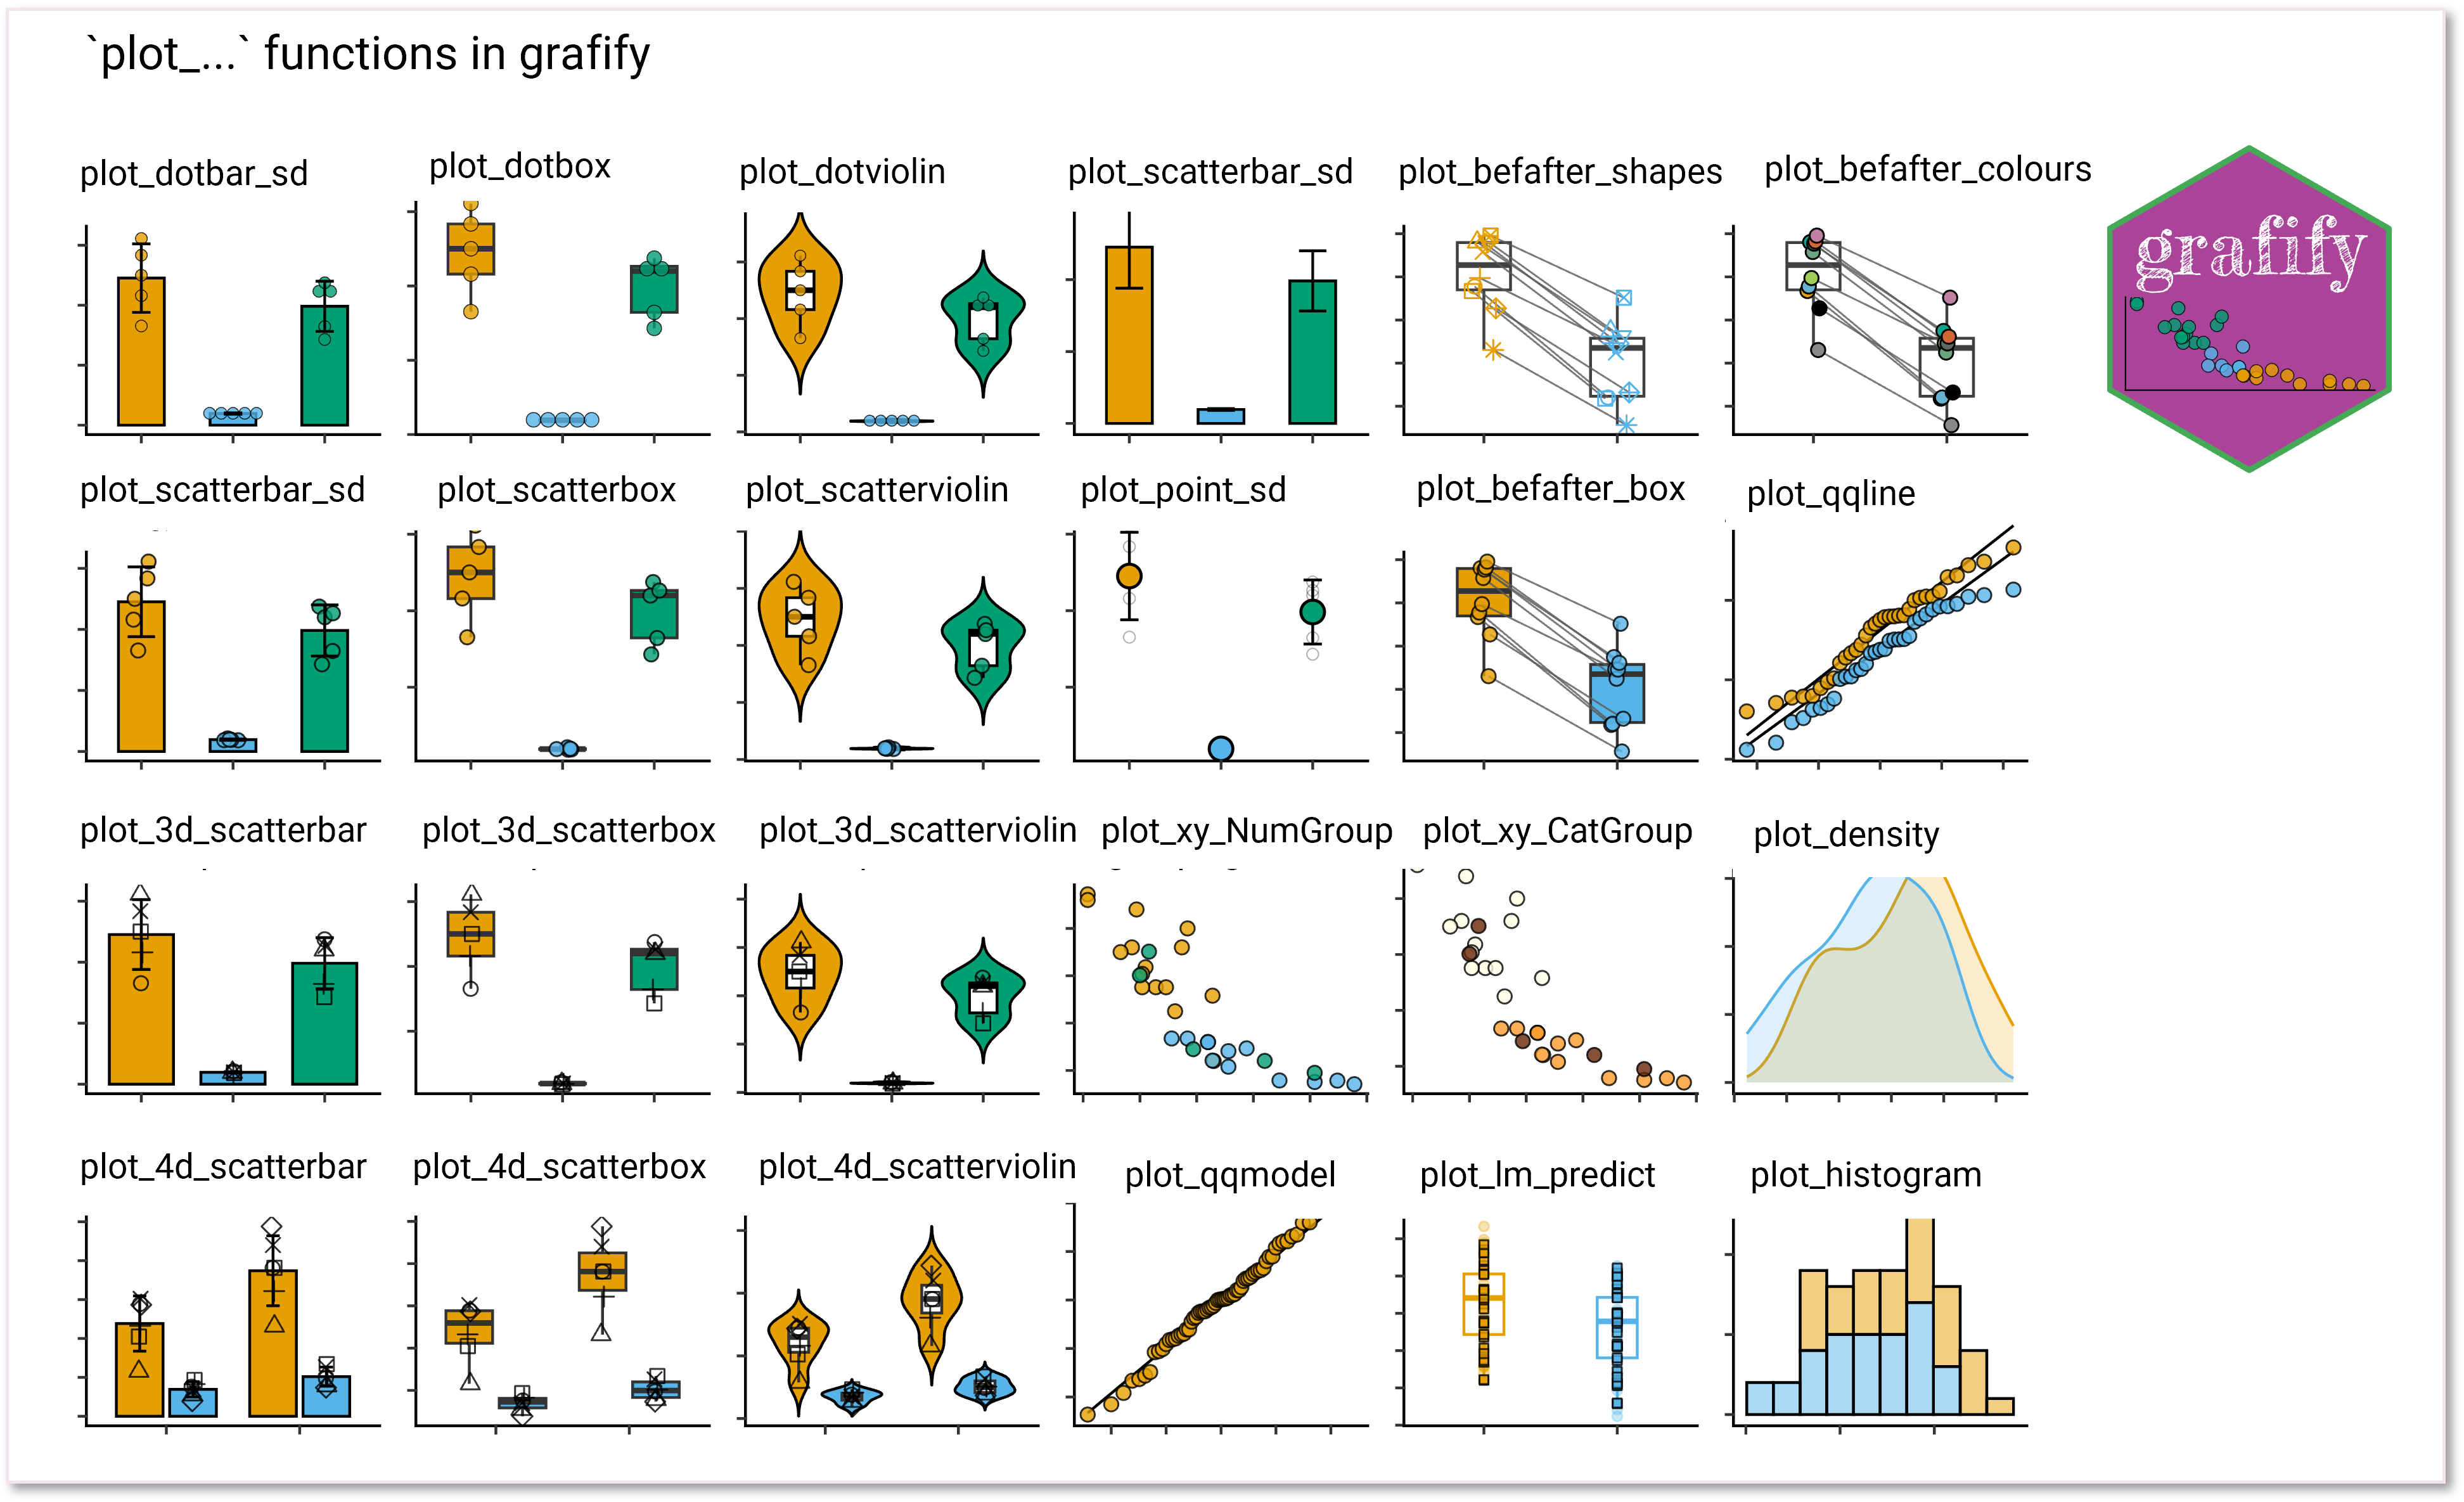
Hint: Is it one of these graphs you need?
Graph 1
Use dataset data_1w_death.
Hint: Check the data frame and names of columns (variables). Then plot a graph with scattered data and bars.
Loading required package: ggplot2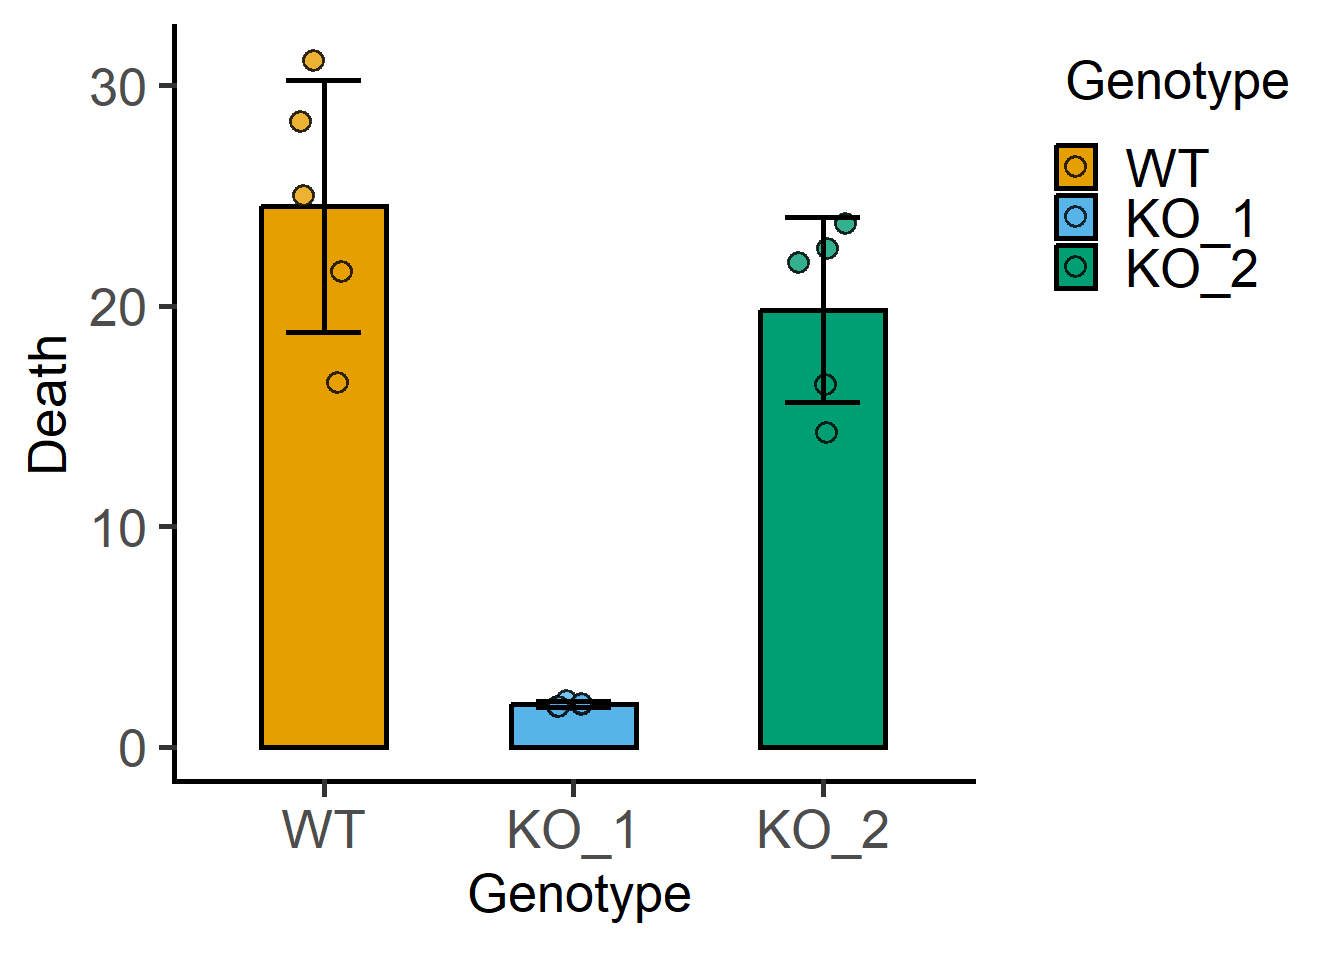
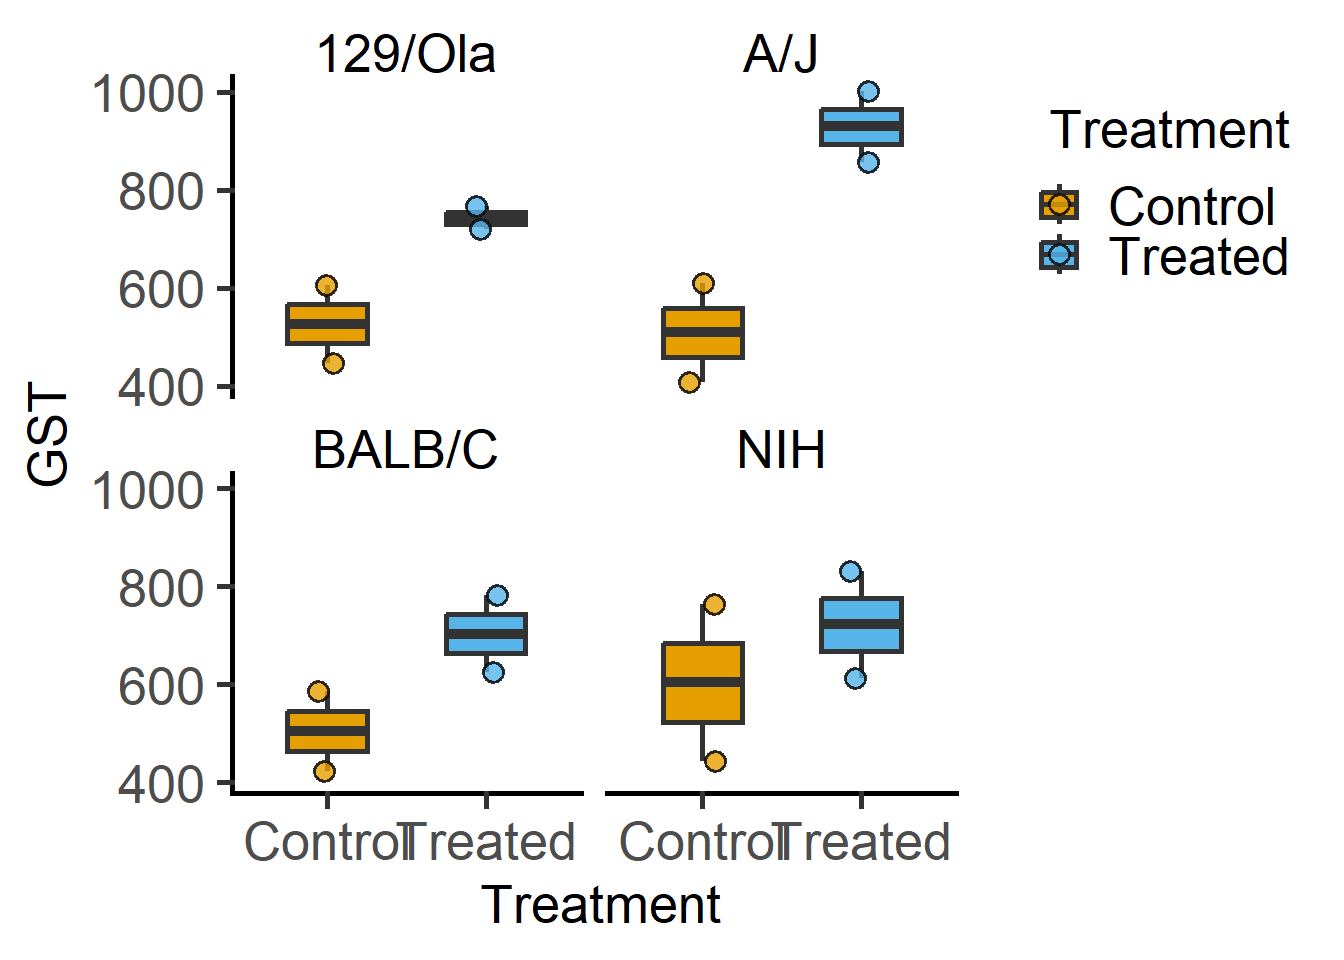
Graph 2
Use dataset data_2w_Festing.
Hint: It is a box and whiskers plot graph with facet argument to add another variable (Strain).
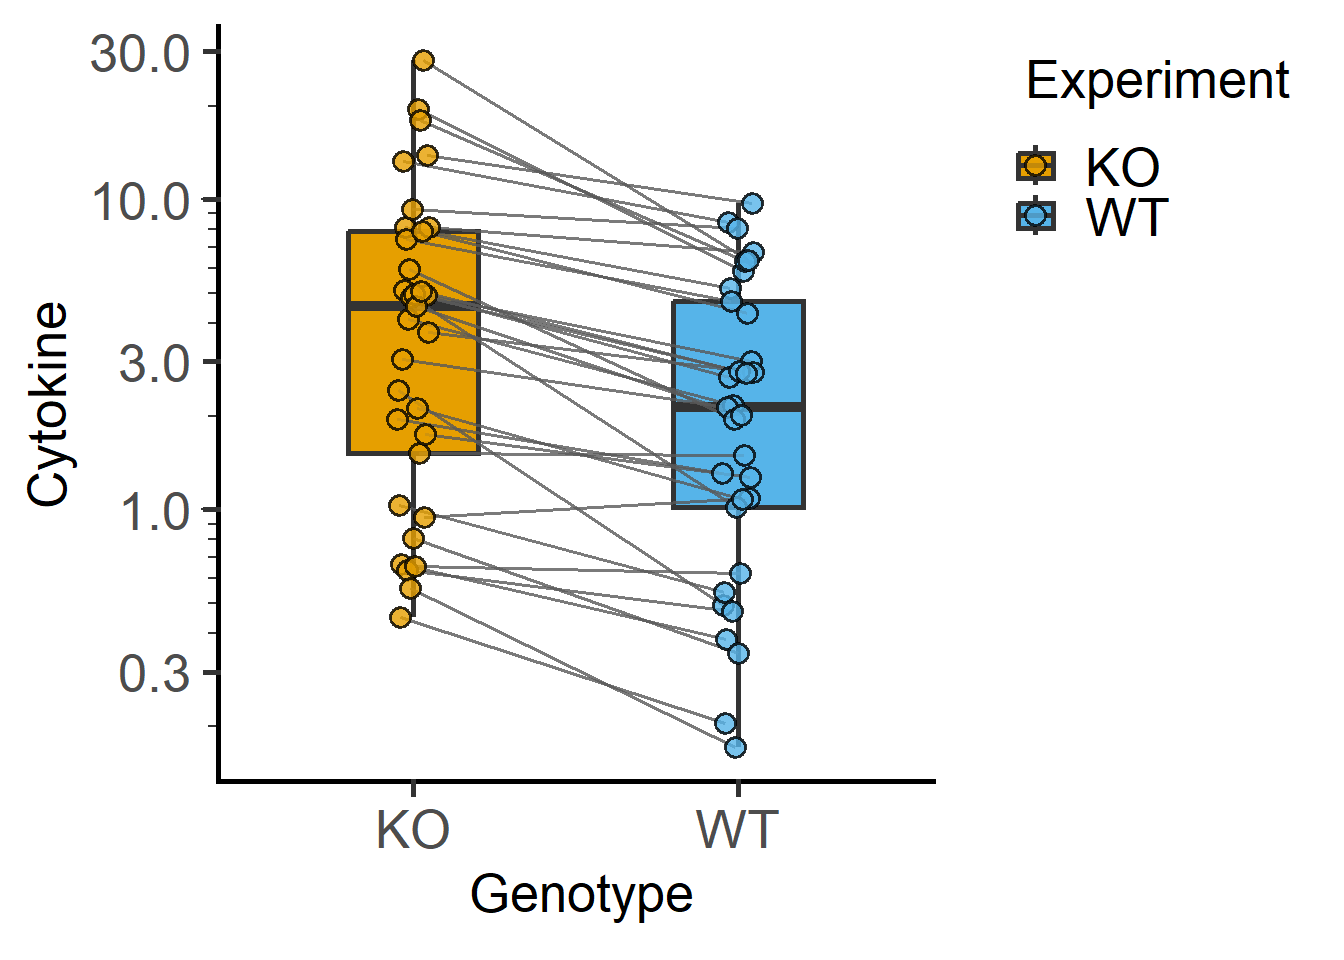
Graph 3
Use dataset data_t_pratio.
Hint: This is a before-after plot of matched observations.
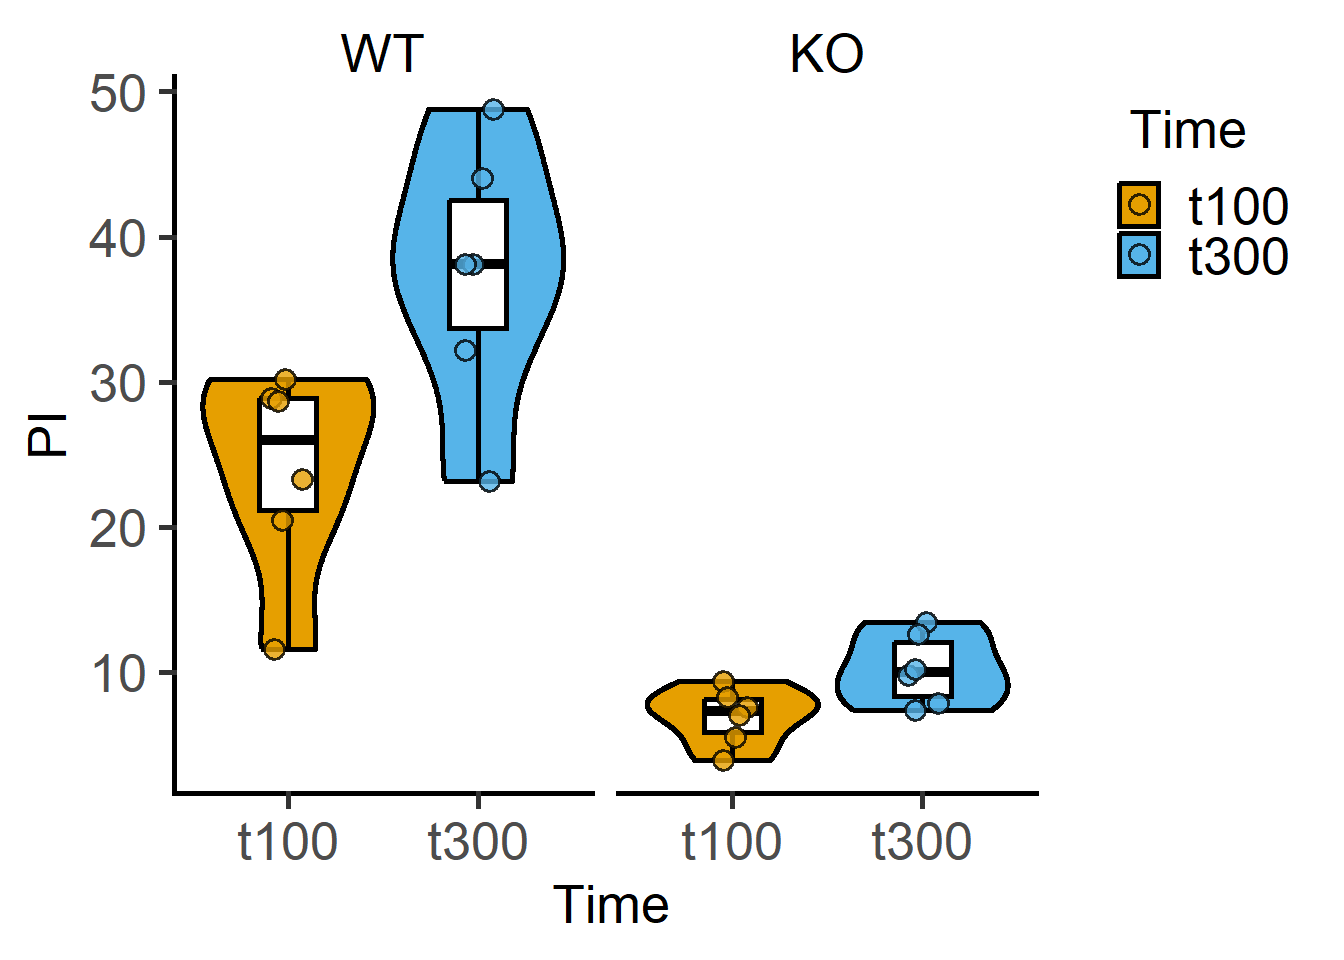
Graph 4
Use dataset data_2w_Tdeath.
Hint: It is a violin plot with scattered dots with facet argument to add the Genotype.